
In a world driven by data, the success of sales teams hinges on their ability to analyze and interpret information effectively.
According to McKinsey, businesses that harness data for decision-making are 19 times more likely to thrive.
Welcome to Sales Analytics 101: your go-to guide for understanding the fundamentals, tools, and metrics that empower sales leaders.
From uncovering valuable insights to optimizing strategies, this journey will equip you with the knowledge to drive profitability and outperform competitors.
Let’s dive in together and unlock the power of sales analytics for your team’s success.
What is Sales Analytics?
Here’s a simple definition:
Sales analytics is the practice of analyzing sales data to gain insights and optimize sales strategies for increased revenue and efficiency.
Now, let’s dive a bit deeper:
Sales analytics is the process of analyzing sales data to gain insights into sales performance, customer behavior, and market trends. It involves collecting, processing, and interpreting data from various sources, such as CRM systems, transaction records, and marketing campaigns.
Sales analytics enables businesses to understand their sales processes better, identify areas for improvement, and make data-driven decisions to optimize sales strategies and increase revenue.
By leveraging statistical analysis, data visualization, and predictive modeling techniques, sales analytics empowers organizations to enhance sales efficiency, target the right customers, and stay ahead of market dynamics. Ultimately, it drives informed decision-making and improves overall sales performance.
Related: Identifying triggers & buying signals in B2B sales calls
Benefits of Sales Analytics
Here are some benefits of using sales analytics for your business:
- Data-Driven Decision Making: Sales analytics provides actionable insights based on data, enabling informed decision-making at every level of the sales process.
- Improved Sales Performance: By analyzing sales data, organizations can identify trends, patterns, and opportunities to optimize sales strategies and enhance performance.
- Enhanced Customer Understanding: Sales analytics helps businesses gain a deeper understanding of customer behavior, preferences, and needs, allowing for personalized and targeted sales approaches.
- Resource Allocation Efficiency: By identifying high-performing sales channels and focusing resources accordingly, organizations can optimize their investments and maximize returns.
- Forecasting Accuracy: Sales analytics enables accurate sales forecasting by analyzing historical data and market trends, helping businesses anticipate demand and plan resources effectively.
- Sales Team Optimization: By tracking individual and team performance metrics, sales analytics facilitates coaching, training, and performance management to maximize the effectiveness of sales teams.
- Competitive Advantage: Leveraging sales analytics allows organizations to stay ahead of competitors by quickly adapting to market changes, identifying emerging trends, and capitalizing on new opportunities.
- Improved Customer Satisfaction: By understanding customer preferences and behaviors, sales analytics enables businesses to tailor their offerings and services to meet customer needs more effectively, leading to higher satisfaction and loyalty.
- Cost Reduction: By identifying inefficiencies and areas for improvement in the sales process, sales analytics helps organizations streamline operations and reduce unnecessary costs.
- Real-time Insights: With the use of advanced analytics tools, organizations can access real-time sales data, enabling timely decision-making and response to market dynamics.
Related: 10 Best Sales Intelligence Software For 2024
8 Steps to Run a Sales Data Analysis
Here are some key steps you must follow to run a sales data analysis:
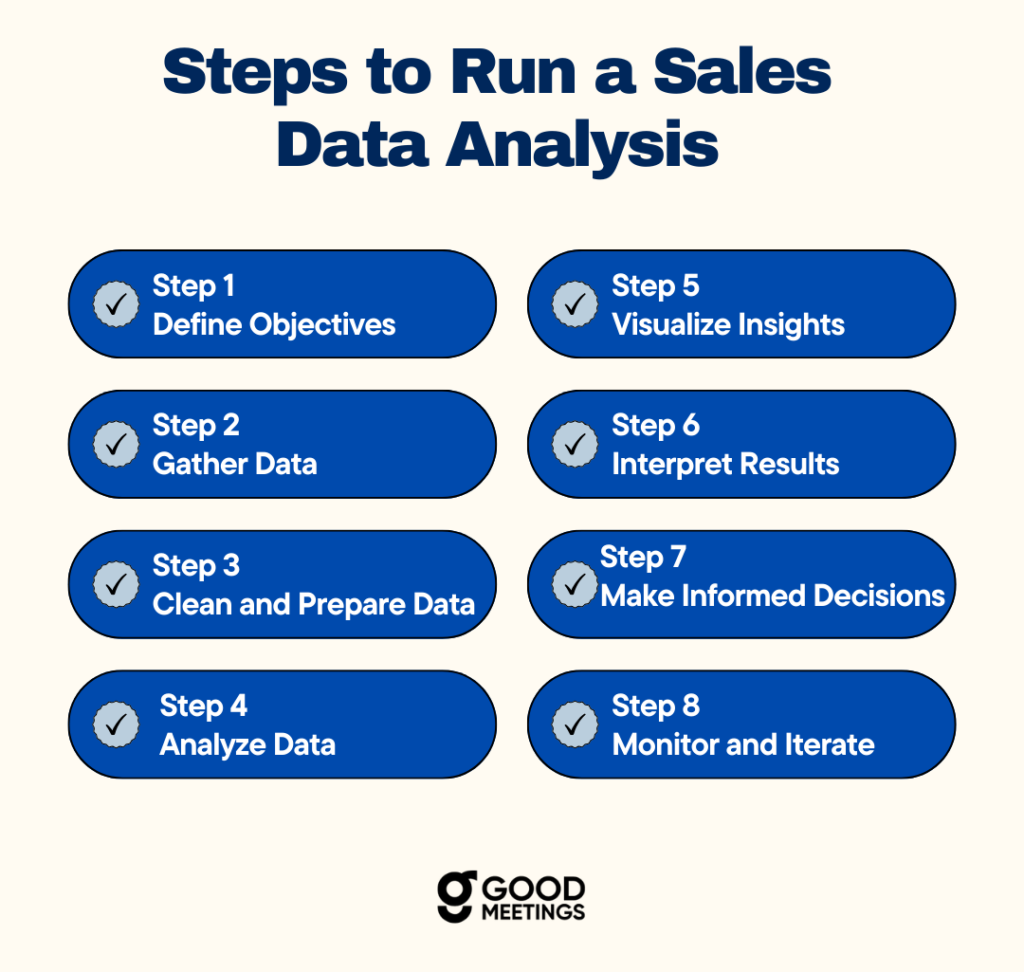
Step 1: Define Objectives
- Clearly outline the goals and objectives of your analysis. Determine what specific insights you aim to uncover and how they will contribute to your sales strategy.
- Identify key metrics and data points relevant to your objectives.
Step 2: Gather Data
- Collect relevant sales data from sources such as CRM systems, spreadsheets, or databases.
- Ensure the data is clean, accurate, and complete by removing duplicates, correcting errors, and filling in missing information.
Step 3: Clean and Prepare Data
- Cleanse the data by standardizing formats, removing outliers, and addressing any inconsistencies.
- Transform the data into a format suitable for analysis, such as organizing it into rows and columns or creating calculated fields.
Step 4: Analyze Data
- Utilize statistical analysis techniques to explore trends, patterns, and relationships within the data.
- Use tools like Excel, statistical software, or data visualization platforms to conduct analysis and generate insights.
Related: Mastering Sales Demos: The Ultimate Guide to Winning & Closing More Deals
Step 5: Visualize Insights
- Create visualizations such as charts, graphs, and dashboards to represent your findings in a clear and compelling manner.
- Visualize key performance indicators (KPIs), sales trends, and other relevant insights to facilitate understanding and decision-making.
Step 6: Interpret Results
- Interpret the analysis results in the context of your defined objectives and business goals.
- Identify actionable insights and recommendations based on the analysis findings.
Step 7: Make Informed Decisions
- Use the insights gained from the analysis to inform strategic decisions and optimize sales strategies.
- Implement changes and adjustments to sales tactics, resource allocation, or customer targeting based on the analysis findings.
Step 8: Monitor and Iterate
- Continuously monitor sales performance metrics and track the impact of implemented changes.
- Iterate on the analysis process as needed, incorporating new data sources or refining analysis techniques to improve accuracy and effectiveness.
Related: SaaS Sales 101: Definition, Models & Best Practices
10 Sales Metrics To Watch Closely
Here are some important sales metrics you need to watch closely:
Metric 1 – Conversion Rate
- What: Conversion rate measures the percentage of leads or prospects that result in a successful sale. It indicates the effectiveness of your sales process in converting leads into customers.
- Why: Monitoring conversion rate helps identify areas for improvement in the sales funnel and assess the overall efficiency of your sales efforts.
- Formula: Conversion Rate = (Number of Conversions / Number of Leads) * 100
- Examples: If 100 leads result in 10 conversions, your conversion rate is 10%.
Metric 2 – Average Deal Size
- What: Average deal size refers to the average monetary value of each sale closed by your sales team.
- Why: Tracking average deal size helps evaluate the value of your sales transactions and track changes over time.
- Formula: Average Deal Size = Total Revenue / Number of Deals Closed
- Examples: If total revenue for the month was $50,000 from 20 closed deals, the average deal size is $2,500.
Related: 15 Best AI Sales Tools & Software [2024]
Metric 3 – Sales Velocity
- What: Sales velocity measures the speed at which deals move through your sales pipeline, from initial contact to closed sale.
- Why: Monitoring sales velocity helps identify bottlenecks in the sales process and assess the overall efficiency of your sales team.
- Formula: Sales Velocity = (Number of Deals * Average Deal Value) / Sales Cycle Length
- Examples: If you closed 50 deals with an average value of $1,000 each, and the average sales cycle length is 30 days, the sales velocity would be $1,667 per day.
Metric 4 – Customer Acquisition Cost (CAC)
- What: Customer Acquisition Cost (CAC) measures the average cost of acquiring a new customer, including sales and marketing expenses.
- Why: Monitoring CAC helps assess the effectiveness of your sales and marketing efforts and ensure they generate a positive return on investment.
- Formula: CAC = Total Sales and Marketing Expenses / Number of New Customers Acquired
- Examples: If $10,000 is spent on sales and marketing, resulting in 100 new customers, the CAC is $100.
Related: Complete Guide to Sales Battlecards – What Are They and How to Use Them?
Metric 5 – Customer Lifetime Value (CLV)
- What: Customer Lifetime Value (CLV) represents the total revenue a customer is expected to generate over their entire relationship with your company.
- Why: Monitoring CLV helps prioritize customer segments and allocate resources effectively to maximize long-term profitability.
- Formula: CLV = Average Revenue per Customer * Average Customer Lifespan
- Examples: If the average revenue per customer is $500 per year, and the average customer lifespan is 5 years, the CLV would be $2,500.
Metric 6 – Win Rate
- What: Win rate measures the percentage of deals won compared to the total number of deals pursued.
- Why: Monitoring win rate helps assess the effectiveness of your sales team in closing deals and identify areas for improvement in the sales process.
- Formula: Win Rate = (Number of Won Deals / Total Number of Deals Pursued) * 100
- Examples: If your sales team won 20 out of 100 deals pursued, the win rate would be 20%.
Metric 7 – Sales Pipeline Coverage
- What: Sales pipeline coverage measures the ratio between the value of deals in the pipeline and the sales target.
- Why: Monitoring pipeline coverage helps ensure there are enough opportunities in the pipeline to meet sales targets and provides visibility into future revenue.
- Formula: Pipeline Coverage = (Value of Deals in Pipeline / Sales Target) * 100
- Examples: If the value of deals in the pipeline is $500,000 and the sales target is $1,000,000, the pipeline coverage would be 50%.
Related: How to Use AI For Sales Training – Tools and Best Practices
Metric 8 – Sales Cycle Length
- What: Sales cycle length measures the average time it takes to close a deal from initial contact to sale.
- Why: Monitoring sales cycle length helps identify inefficiencies in the sales process and optimize resource allocation to accelerate deal closure.
- Formula: Sales Cycle Length = (Total Time to Close Deals / Number of Deals Closed)
- Examples: If it takes an average of 30 days to close a deal and 20 deals were closed last month, the sales cycle length would be 30/20 = 1.5 days.
Metric 9 – Upsell/Cross-sell Rate
- What: Upsell/cross-sell rate measures the percentage of customers who purchase additional products or services beyond their initial purchase.
- Why: Monitoring upsell/cross-sell rate helps identify opportunities to increase revenue from existing customers and improve customer lifetime value.
- Formula: Upsell/Cross-sell Rate = (Number of Upsells/Cross-sells / Total Number of Customers) * 100
- Examples: If 50 out of 200 customers make additional purchases, the upsell/cross-sell rate would be 25%.
Metric 10 – Sales to Quota Ratio
- What: Sales to quota ratio compares actual sales performance against assigned sales quotas.
- Why: Monitoring sales to quota ratio helps assess sales team performance and ensure targets are being met or exceeded.
- Formula: Sales to Quota Ratio = (Actual Sales / Sales Quota) * 100
- Examples: If a salesperson achieves $80,000 in sales against a $100,000 quota, the sales to quota ratio would be 80%.
Related: A Complete Guide to Sales Call Reporting: Tips, Templates & Tools
6 Best Sales Analytics Tools 2024
Sales analytics is crucial for organizations to gain insights into their sales performance, customer behavior, and overall business health. Let’s explore some of the best sales analytics tools available in 2024.
1. Goodmeetings

Source: Goodmeetings
Goodmeetings is an AI-driven platform designed to optimize sales meetings and enhance sales team performance. If you are running a remote sales team and need advanced meeting analytics, Goodmeetings is the best choice. It can help you record, transcribe, summarize, and analyze all your important sales conversations for better decision-making, coaching sales reps and closing more deals.
- Features/Benefits/Specifications: Captures meeting intel, transcribes audio, and generates summaries with key insights. Automates action items, provides human-level summaries, and offers real-time assistance. Utilizes AI for instant natural language querying and proactive alerts during meetings.
- Who Uses It: Sales teams and managers seeking to streamline meetings, capture insights, and boost productivity.
- Final Thoughts: Goodmeetings revolutionizes sales meetings with its AI-driven features, empowering teams to make data-driven decisions and close deals faster.
- Pricing: Goodmeetings offer two paid plans. Professional – $50 per month and Business – $75 per month. You can also request a free demo and try any of these plans for free with a 7-day trial offer.
GET IN TOUCH
Get Crucial Sales Meeting Insights With Goodmeetings!
Related: What is Sales Acceleration? – Tools and Tactics Included
2. Salesforce Sales Cloud
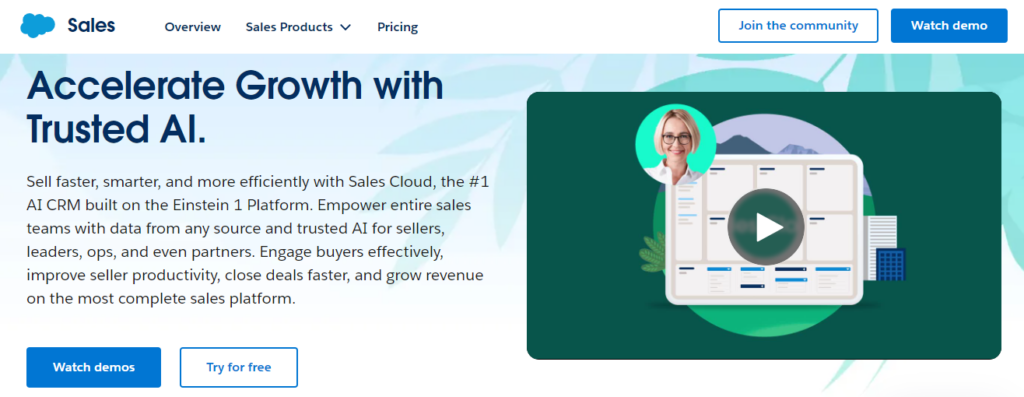
Source: Salesforce
Salesforce Sales Cloud is a comprehensive CRM platform designed to manage customer relationships, sales processes, and sales performance.
- Features/Benefits/Specifications: Offers customizable dashboards, advanced reporting tools, forecasting capabilities, lead management, and integration with other Salesforce products. It caters to sales teams of all sizes and industries.
- Who Uses It: Sales teams, sales managers, sales operations professionals, and businesses looking to improve their sales processes and drive revenue growth.
- Final Thoughts: Salesforce Sales Cloud is a market-leading CRM solution known for its robust features, scalability, and flexibility. It’s suitable for businesses of all sizes and industries.
- Pricing: There are five paid plans available. Starter Suite – $25 per month, Professional – $80 per month, Enterprise – $165 per month, Unlimited – $330 per month and Einstein 1 Sales – $500 per month.
Related: 10 Critical Sales Communication Skills For Success in 2024
3. HubSpot Sales Hub
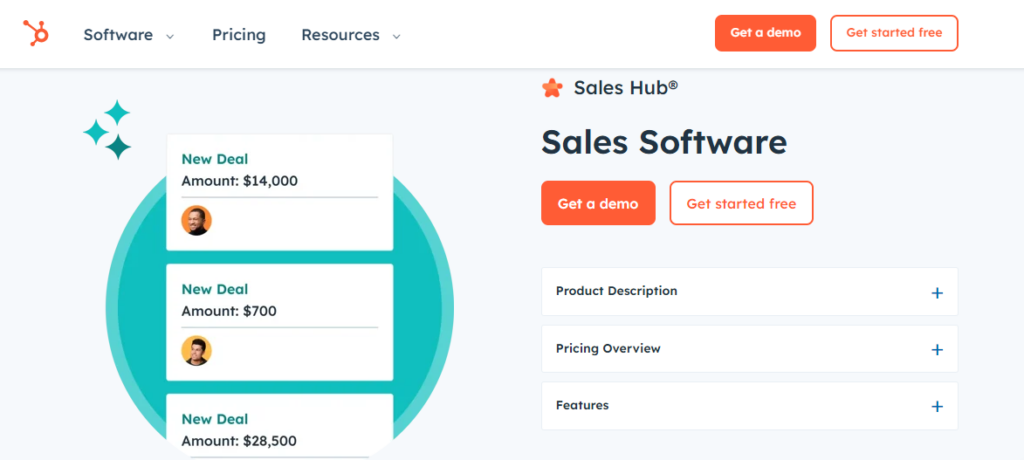
Source: HubSpot
HubSpot Sales Hub is a CRM software that offers sales analytics, sales automation, and contact management features.
- Features/Benefits/Specifications: Provides sales pipeline management, email tracking, prospecting tools, and customizable reporting capabilities.
- Who Uses It: Sales teams, sales managers, small to midsize businesses, and organizations looking for an all-in-one CRM and sales solution.
- Final Thoughts: HubSpot Sales Hub is known for its user-friendly interface, integrated marketing tools, and comprehensive sales features. It’s an excellent choice for businesses looking to align sales and marketing efforts.
- Pricing: HubSpot Sales Hub offers a free plan and three paid plans. Starter – $20 per month, Professional – $800 per month and Enterprise – $3,600 per month.
Related: ChatGPT for Sales: 10 Ways to Boost Your Sales Revenue Using ChatGPT
4. Zoho CRM
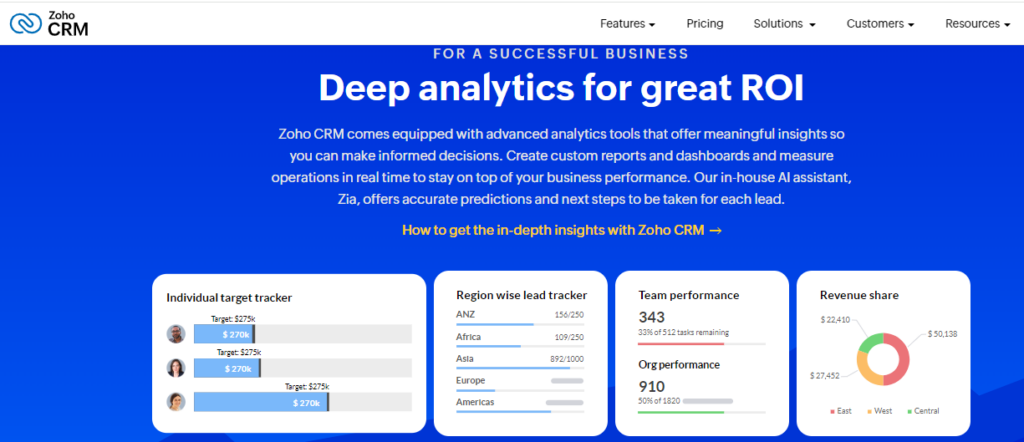
Source: Zoho CRM
Zoho CRM is a cloud-based CRM software that offers sales automation, lead management, and sales analytics tools.
- Features/Benefits/Specifications: Provides customizable dashboards, sales forecasting, pipeline management, and workflow automation capabilities.
- Who Uses It: Sales teams, small to midsize businesses, and organizations looking for an affordable CRM solution with robust sales analytics features.
- Final Thoughts: Zoho CRM is praised for its affordability, ease of use, and wide range of features. It’s suitable for businesses seeking a cost-effective CRM solution with powerful sales analytics capabilities.
- Pricing: There are four paid plans available. Standard – $20 per month, Professional – $35 per month, Enterprise – $50 per month, and Ultimate – $65 per month.
Related: 4 Ways To Measure and Improve Sales Effectiveness
5. InsightSquared
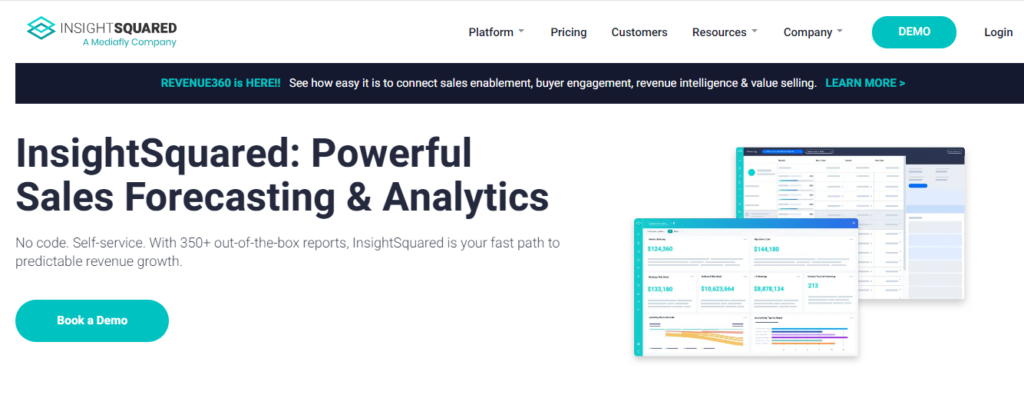
Source: InsightSquared
InsightSquared is a sales analytics platform designed to help businesses optimize their sales performance and drive revenue growth.
- Features/Benefits/Specifications: Offers pre-built dashboards, revenue forecasting tools, pipeline analytics, and AI-driven insights to help organizations improve sales effectiveness.
- Who Uses It: Sales teams, sales operations professionals, and organizations looking for advanced sales analytics and reporting solutions.
- Final Thoughts: InsightSquared is known for its user-friendly interface, powerful analytics capabilities, and ability to integrate with CRM systems such as Salesforce and HubSpot. It’s ideal for businesses seeking actionable insights to improve sales performance.
- Pricing: Pricing information is available upon request. More information can be found on the InsightSquared website.
Related: Gong Alternatives: Gong Competitors You Must Consider in 2024
6. Pipedrive
Source: Pipedrive
Pipedrive is a sales CRM software that offers sales analytics, pipeline management, and contact organization features.
- Features/Benefits/Specifications: Provides customizable reports, sales forecasting tools, email integration, and activity tracking to help sales teams manage leads and deals effectively.
- Who Uses It: Sales teams, sales managers, and small to midsize businesses looking for a user-friendly CRM solution with robust sales analytics capabilities.
- Final Thoughts: Pipedrive is known for its intuitive interface, visual sales pipeline, and automation features. It’s suitable for businesses seeking a straightforward CRM solution to streamline sales processes and drive growth.
- Pricing: There are five paid plans available. Essential – $9.90 per month, Advanced – $19.90 per month, Professional – $39.90 per month, Power – $49.90 per month and Enterprise – $59.90 per month.
Related: Elevating Sales Performance: A Comprehensive Guide to Sales Leaderboards
What to Look for in Sales Analytics Tools?
When evaluating sales analytics tools, there are several key factors to consider to ensure you choose the right solution for your business. Here’s what to look for:
- Ease of Use: Choose a tool that is intuitive and user-friendly, allowing your sales team to quickly adopt and leverage its features without extensive training.
- Customization Options: Look for tools that offer customization options for dashboards, reports, and metrics, allowing you to tailor the tool to your specific business needs and KPIs.
- Integration Capabilities: Ensure the tool integrates seamlessly with your existing systems and data sources, such as CRM software, marketing automation platforms, and other business applications.
- Data Visualization: Opt for tools that offer advanced data visualization capabilities, such as interactive charts, graphs, and heatmaps, to help you gain insights from your sales data quickly and easily.
- Predictive Analytics: Consider tools that offer predictive analytics capabilities, allowing you to forecast sales trends, identify opportunities, and mitigate risks based on historical data and predictive modeling.
- Real-Time Reporting: Look for tools that provide real-time reporting and analytics, allowing you to monitor sales performance, track KPIs, and make informed decisions on the fly.
- Mobile Accessibility: Choose a tool that is accessible on mobile devices, enabling your sales team to access sales analytics and reports anytime, anywhere, and stay productive on the go.
- Scalability: Ensure the tool can scale with your business as it grows, accommodating increased data volume, user accounts, and analytics requirements without compromising performance.
- Security: Prioritize tools that offer robust security features, such as data encryption, access controls, and compliance certifications, to protect sensitive sales data and ensure regulatory compliance.
- Customer Support: Consider the level of customer support and training offered by the tool provider, ensuring you have access to technical assistance, resources, and training materials to maximize the value of the tool.
Related: 11 Effective Ways To Improve Sales Conversations & Drive More Revenue
Right Way To Analyze Sales Performance

Source: Goodmeetings
Goodmeetings is an AI-powered platform designed to enhance meeting performance and drive sales productivity. It offers a range of features to streamline sales processes, capture valuable insights, and improve overall sales performance.
It integrates seamlessly with existing CRM systems and workflow tools to streamline sales operations and drive revenue growth.
How Goodmeetings Helps Analyze and Improve Sales Performance?
- Accelerate Sales Outcomes Using AI: Goodmeetings leverages AI to capture meeting intelligence, providing valuable insights into customer interactions, sales pitches, and deal progress.
- Capture Meeting Intel: The platform captures every detail of sales meetings, including call recordings, transcriptions, and key moments, enabling sales teams to review and analyze past interactions.
- Automate Processes: Goodmeetings automates mundane tasks such as action item assignments and meeting summaries, freeing up time for sales reps to focus on high-value activities and closing deals.
- Close Deals Faster: By providing real-time assistance during meetings and offering insights into customer sentiment and engagement, Goodmeetings helps sales reps articulate their value proposition effectively and close deals faster.
- Continuous Improvement: With AI-generated transcripts, summaries, and performance insights, Goodmeetings facilitates continuous improvement for sales teams, enabling them to refine meeting strategies, identify areas for improvement, and optimize sales performance over time.
Goodmeetings is a powerful tool for analyzing and improving sales performance, offering advanced features such as meeting intel capture, process automation, and real-time assistance.
By leveraging AI technology and providing actionable insights, Goodmeetings empowers sales teams to drive productivity, close more deals, and achieve greater success in their sales efforts.
Wrapping Up
Sales analytics is essential for businesses to make informed decisions, optimize strategies, and drive revenue growth. With a variety of tools and metrics available, sales teams can analyze data effectively to improve performance. Among these tools, Goodmeetings stands out for its AI-powered meeting intelligence platform, streamlining processes, capturing insights, and enhancing sales performance with real-time assistance and automation.
GET IN TOUCH