

In sales, the focus isn’t just on actions but on what is measured and improved.
“Metric,” originating from the Latin “metrum” (meaning measure), refers to quantifiable elements. These metrics, when displayed on trackers or dashboards, guide the strategic focus of sales activities and inform future performance enhancements. Key Performance Indicators (KPIs) are commonly used terms for these performance metrics. It’s crucial for businesses to track specific key sales performance metrics to monitor and enhance their sales efforts effectively. There is also one essential metric that should always be prioritized on your dashboard.
What Are Sales Performance Metrics
Sales performance metrics are quantitative measures used to track and assess the effectiveness of a sales team. Tracking these metrics is crucial as it helps in evaluating the sales team’s performance, identifying areas for improvement, and aligning sales activities with business goals.
There are three main categories of sales performance metrics:
- Activity Metrics: Track the actions of sales reps, like number of calls made or meetings held.
- Productivity Metrics: Measure the efficiency of sales activities, like leads generated per hour.
- Success Metrics: Focus on outcomes, such as conversion rates or average deal size.
These set of metrics is ubiquitous to all businesses. Whatever your focus be, you have to be tracking these. Here are the 11 key metrics to improve sales performance:
Basic Business KPIs
1. Sales Growth
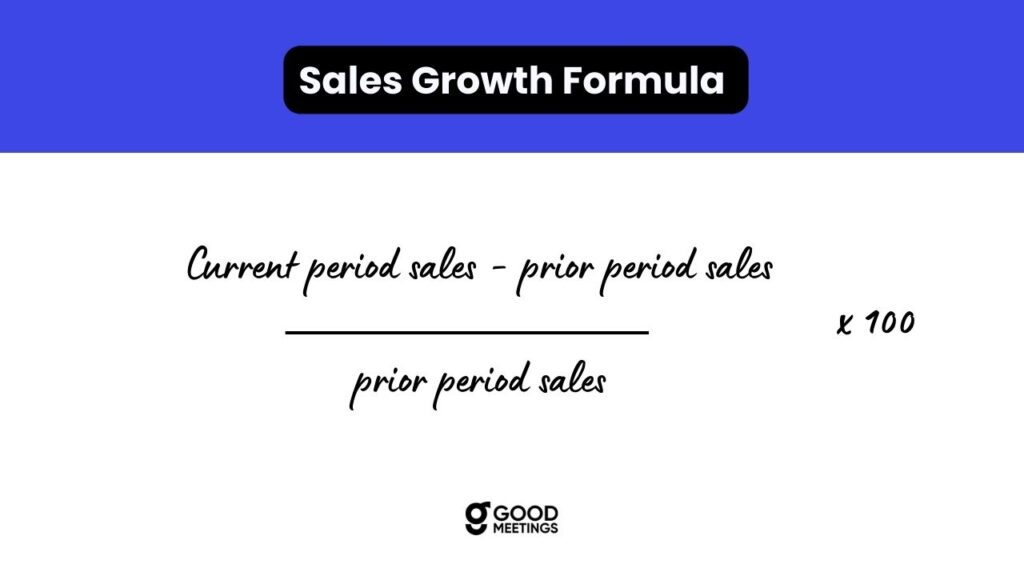
This metric represents the growth in sales revenue over the exiting period compared to the past period. It could be tracked on a quarterly or annual basis depending on the company policy. The Sales Growth metric helps companies in deciding their future sales and competitive strategy. For example, if the sales numbers are dipping, the company could look at its distribution system or product pricing. If they are increasing, the company would probably, want to diversify the increased revenue in new markets.
Sales growth can be measured using the following formula:
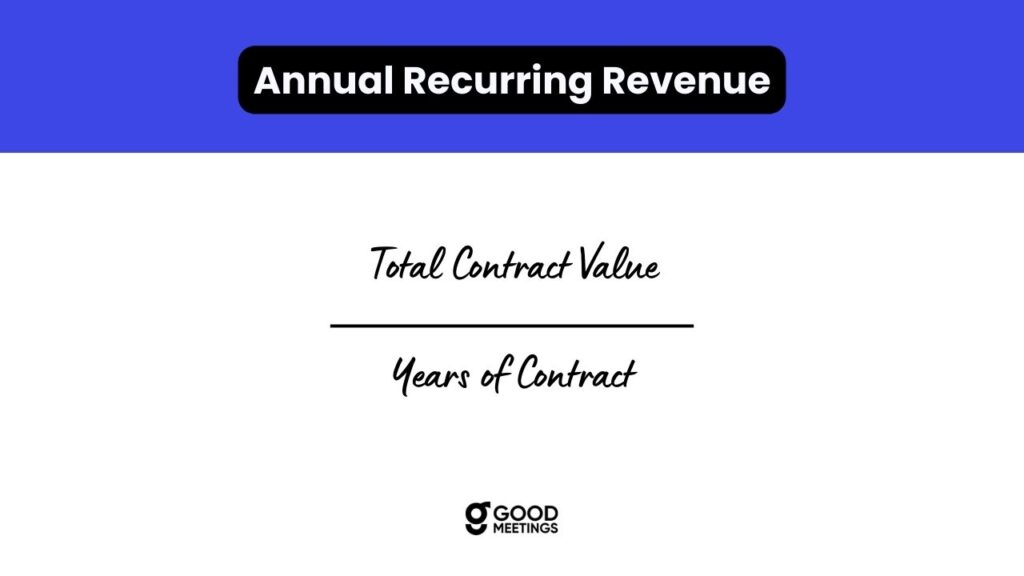
2. Annual Recurring Revenue (ARR)
If you have a business with subscription-based pricing, ARR is a metric that you should be tracking. In simple terms, ARR is a metric that denotes money that your business earns every year from new and renewed subscriptions and add-ons. It also takes into account the losses from if a customer chooses to leave your business or chooses to downgrade the level of service that you previously offered them. For example, if you choose to renew or upgrade your Netflix plan, you impact the ARR positively. However, if you plan to move down your Netflix subscription or choose to not renew at all, you negatively impact the ARR. ARR can be calculated as:
Sales Productivity Metrics
These metrics are highly useful in determining the issues and loopholes in your sales process. While many metrics like conversation rate, opportunity response time, opportunity overdue, etc., we will focus on two main metrics listed below. These metrics focus on time and the costs incurred during the sales process.
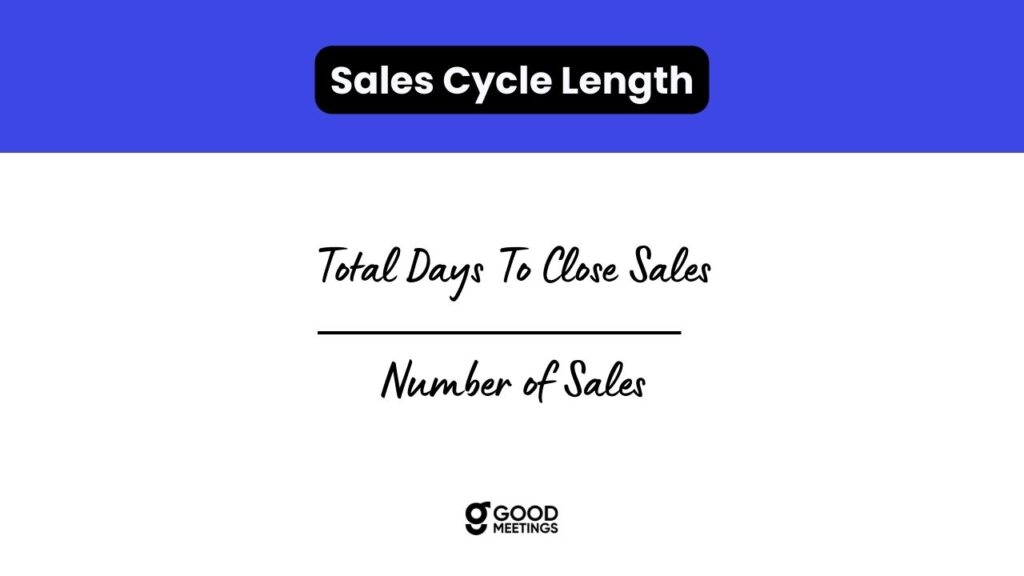
3. Average Length of Sales Cycle
The length of the sales cycle can be defined as the time duration between the first touchpoint that happened with the customer to the closure of the deal – won or lost.
The smaller the sales cycle length, the better it is.
The sales cycle length can be used to create sales forecasts. Additionally, it can be used to measure performance. If a sales representative has a smaller average sales cycle length than the company sales cycle length, they are doing phenomenally great and should be rewarded. If the case is otherwise, training and coaching need to be identified. The length of the sales cycle can also be an identifier of how to pivot the sales (discounts, free accessories, etc.) for a customer who is taking too long to decide.
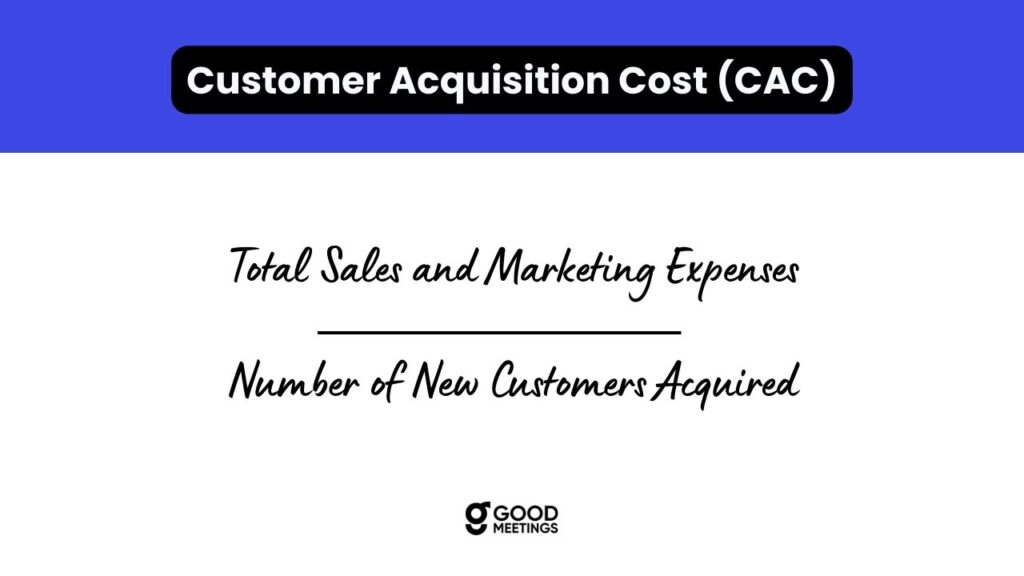
4. Customer Acquisition Cost
Customer Acquisition Cost (CAC) is how much you spend in acquiring a new customer. CAC is calculated on successful deals and not the lost ones. This indicates the spending on lost customers is added to the books of the newly acquired customers. The lower the cost, the better. CAC can be lowered by actually reducing the spending or converting more customers. To ensure viable profits, CAC should be less than or equal to 33% of CLV (Customer Lifetime Value) that is discussed in the section below. CAC can be calculated as:
Customer Oriented Sales Metrics
These metrics offer insights into customer behavior. How long does a customer choose to stay with you? Do customers generally look for discounts? Basis these metrics, you can decide your subscription plans, various offerings, trials, and discounts.
5. Average Customer Lifetime Value (CLV)
In very simple terms ACLV is the amount of money, an average customer spends on your business from the time they start the relationship with your business to the time they stop having any interaction with you. Using this you can measure which customers are more valuable to you and which are not. You can define loyalty programs, offerings, etc. to tune to these customers. You can calculate ACLV as:
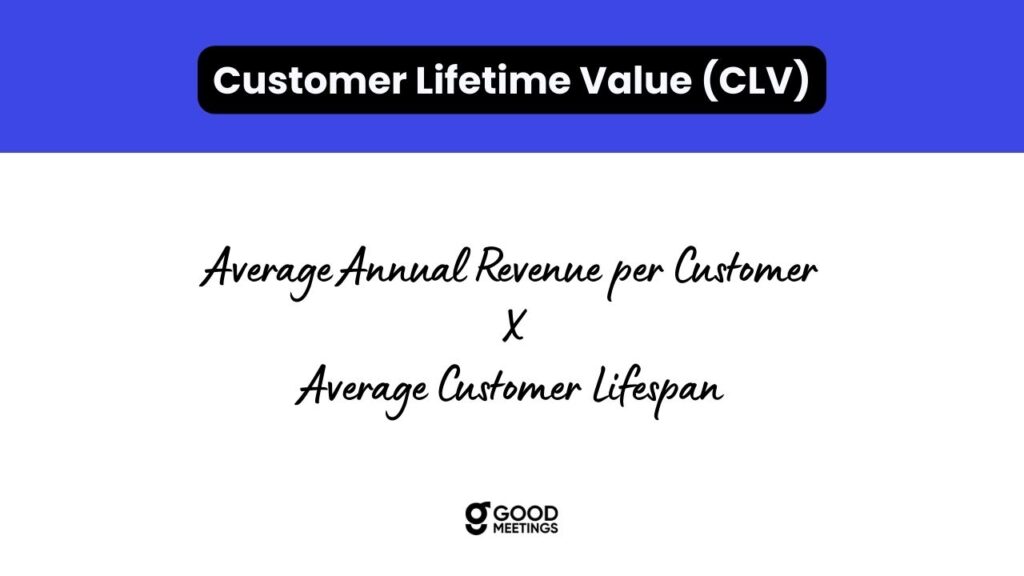
If a customer buys 7 pens from you every year (each pen is worth 10 INR) and continues to buy from you for 6 years before they stop, the CLV of the customer will be 420 INR.
The average of all CLVs of your business will give you the ACLV.
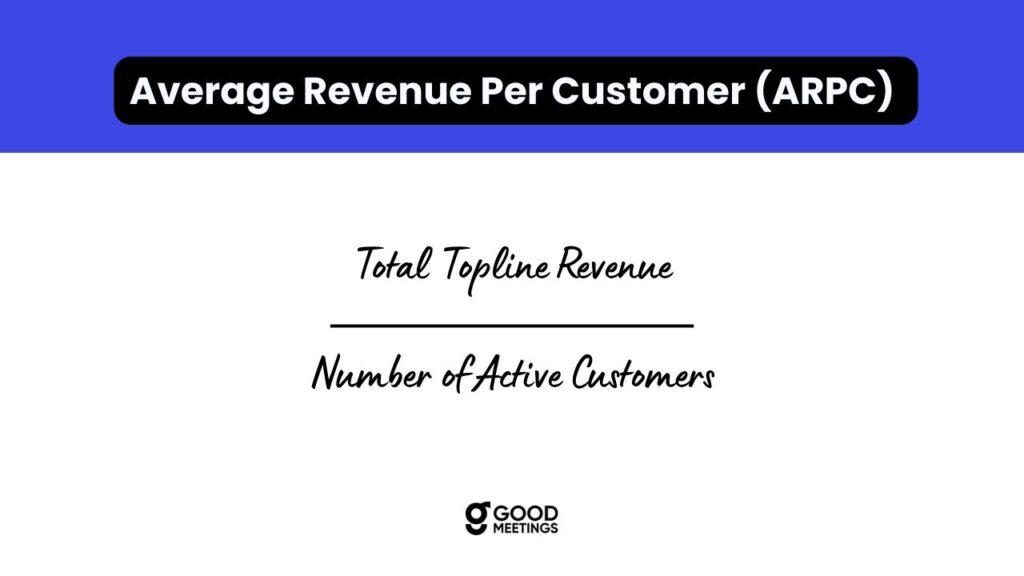
6. Average Revenue per Customer (ARPC)
This metric indicates how much revenue is your business generating from each customer on average. It tracks the growth trajectory of the company and provides a bird eye view of the performance of the business. Often called a macro-level vanity metric because it has no details, ARPC can help you in identifying the health of the business, validating the product pricing and monitoring the performance of the sales and marketing teams. ARPC can be calculated as:
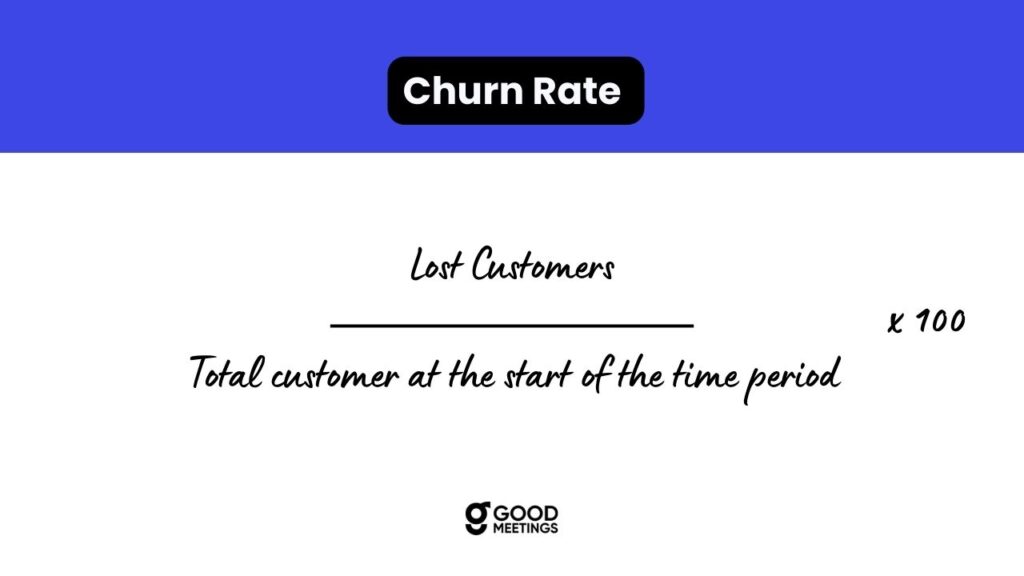
7. Customer Churn Rate
Simply put, customer churn rate signifies the number of customers that leave your business in a specified time. Churn rate indicates the health of the business, gauge your churn w.r.t. industry standards and customer satisfaction with relevance to your products and services. Customer churn rate can be calculated as:
Sales Representative Oriented Metrics
These metrics are an indicator of the performance and needs of the sales representatives in your organization. They can be used to identify how well is the sales team meeting their targets and if any restructuring of goals and team, training, etc. are required to achieve further growth.
8. Average Revenue per Salesperson (ARPS)
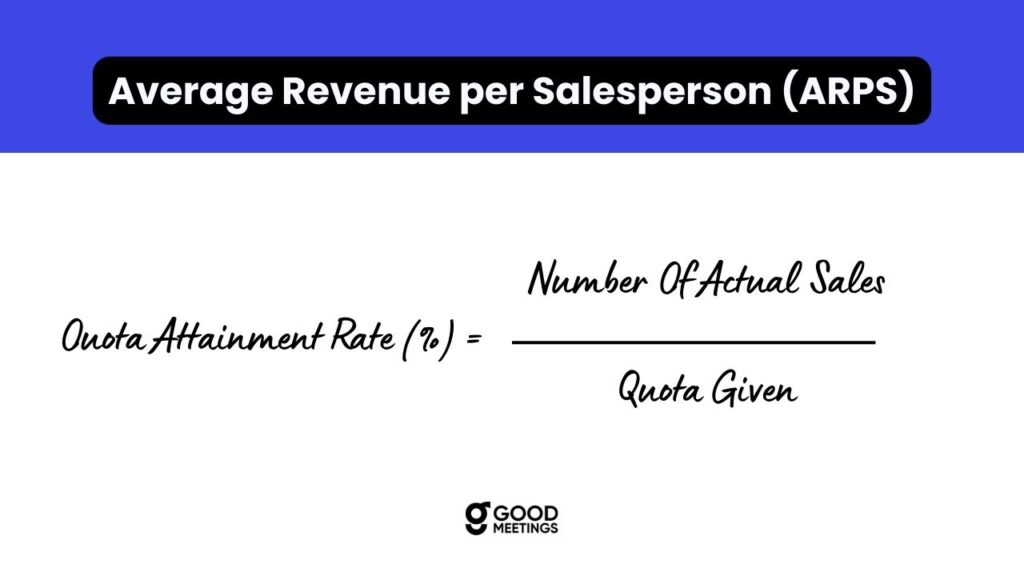
This metric is an indicator of the value of the sales representatives in your organization. It distinguishes sales representatives based on the revenue that they can generate and hence can be used to identify training needs and best practices. ARPS can be calculated as:9. Average Sales Quota Attainment
This metric is useful in deciding whether you are setting realistic targets or identifying new recruitment and training needs.
9. Process Adherence
In technology-driven sales, it is paramount for salespersons to follow the prescribed processes as set by the company policy. Adherence to best practices in meetings – sharing the right materials with customers for objection handling, being attentive & allowing customers to speak, knowing how to close a call properly, keeping the lead warm, knowing when to ask for help, openness to learning from peers, undergoing the prescribed training and constantly measuring performance are some of the key parameters while determining the value of this metric. While there are various methods to calculate this metric, a common approach is to quantify these key parameters and develop a formula that reflects the degree of adherence. This can involve scoring each parameter and calculating an overall adherence score, which provides a quantitative measure of how closely sales activities align with the set standards and procedures.
Advanced Metrics
Advanced metrics are used by mature sales teams that have a digital data repository with required software in place.
10. CRM Score
The CRM score is indicative of the probability with which the deal will close. The CRM score is calculated basis the demography and activity of the lead. If there is a high probability of deal closure, fewer efforts may be needed to put in as compared to the ones with a low probability of deal closure.
11. Sales Linearity
Sales linearity represents the pattern in which deals are closed on a week-to-week basis. Measuring sales linearity avoids the last-minute hustle by ensuring that sales representatives sell consistently over the entire period rather than procrastinating to the last minute. This metric helps to avoid last-minute heavy discounting to achieve the sales target, ensures better cash flow and predictable revenue.
Wrapping up
Metrics are very useful in determining the health of the business and determining the future direction. Tracking and achieving the metrics is as important as defining them. It is challenging to track and achieve your metrics if you have just begun to adopt them. In order to adopt metrics successfully, the first step is to pick the right metrics. Start with the basic ones and use only those metrics for which you have the data. The second and the most important step is to set realistic goals. Setting very ambitious goals can dampen the enthusiasm of the team, while setting lethargic goals can dampen growth. Lastly, always have a dashboard ready to have 100% visibility of the metrics across teams. This visibility fosters coordination and transparency across the entire organization and helps in achieving the targets.
Using GoodMeetings
When choosing sales performance metrics to track, it’s essential to align them with strategic goals, tailor them to your specific product and sales process, start with questions about your sales cycle, and match them to your performance goals.
GoodMeetings aligns perfectly with these strategies by offering tools that enhance the tracking and analysis of key sales metrics. Its features support sales teams in monitoring activity, measuring productivity, and analyzing success metrics effectively, all tailored to specific sales processes and goals. By leveraging GoodMeetings, businesses can gain deeper insights into their sales cycles, optimize strategies, and ultimately drive better sales outcomes.