


Table of contents
Data is the key to sales success!
Did you know? 79% of high-performing sales teams rely on data to guide their strategies.
But there’s one problem – sales data can be overwhelming, and not all of it is relevant.
So, how do you cut through the clutter to find the data that matters? Sales dashboards are the solution.
Sales dashboards help you visualize important data, track performance, and make smart decisions.`
In this article, we present 12 simple sales dashboard examples and templates designed to help you monitor your sales activities effectively.
Whether you are a small business owner or part of a large sales team, these dashboards will provide you with the insights you need to boost your results and achieve your sales goals.
What is a Sales Dashboard?
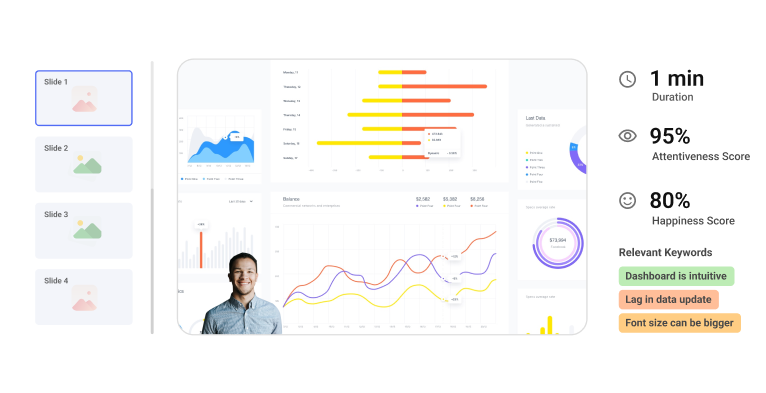
Source: Goodmeetings
A sales dashboard is a visual tool used by sales teams to track key metrics and performance indicators in real-time. It consolidates various data sources into a single interface, allowing users to monitor sales activities, goals, and trends effectively.
By displaying data through charts, graphs, and tables, a sales dashboard helps teams quickly,
- Identify patterns
- Measure progress
- Make informed decisions
It is essential for improving efficiency, forecasting sales, and enhancing overall strategy. Whether for daily operations or long-term planning, a sales dashboard provides the insights needed to drive sales success.
Related: Complete Guide to Sales Battlecards – What Are They and How to Use Them?
Why are Sales Dashboards Important?
Did you know? 82% of businesses using data visualization tools find it easier to understand their company’s data.
That’s why sales dashboards are so important—they offer visual insights that simplify complex sales information, helping teams make smart choices and grow the business.
Here’s why you should use sales dashboards:
1. Data Visualization
They provide a visual representation of sales data, making it easier for users to understand complex information at a glance. Visualizing data helps identify trends, patterns, and anomalies more effectively.
2. Performance Tracking
Sales dashboards allow sales teams and managers to track key performance indicators (KPIs) in real-time or over specific periods. This helps in monitoring progress towards goals and targets.
3. Decision Making
With accurate and up-to-date information readily available, sales dashboards empower decision-makers to make informed decisions quickly. Whether it’s adjusting strategies, allocating resources, or identifying opportunities, having access to relevant data is essential.
4. Goal Setting and Accountability
Sales dashboards often display targets alongside actual performance, providing a clear view of how well the team is meeting objectives. This fosters accountability and helps in setting realistic goals based on past performance and future projections.
5. Identifying Opportunities and Challenges
By analyzing sales data presented in dashboards, teams can identify both opportunities for growth and areas that need improvement. Whether it’s discovering untapped markets, recognizing product trends, or addressing sales bottlenecks, dashboards provide insights that drive strategic decisions.
6. Communication and Collaboration
Sales dashboards serve as a centralized source of information that can be accessed by all relevant stakeholders. This promotes transparency, alignment, and collaboration across different departments within an organization.
7. Forecasting and Planning
By analyzing historical data and current trends, sales dashboards aid in forecasting future sales performance. This enables organizations to anticipate demand, allocate resources effectively, and develop robust sales strategies.
Related: AI in Sales Forecasting: Uses, Benefits & Best Practices
12 Sales Dashboard Examples
Because every sales organization is different, there isn’t one dashboard that fits all. Here are some examples of sales metrics dashboards you can use as models.
1. Sales Activity Dashboard
The sales activity dashboard is a dynamic tool that closely monitors daily sales efforts, guiding teams to improve outreach strategies and productivity.
Audience: Sales Teams and Managers
Key Metrics:
- Daily/Weekly/Monthly Activities (Calls, Emails)
- Outreach Response Rates
- Activity-to-Sale Conversion Rates
- Sales Pipeline Velocity
Purpose:
This sales reporting dashboard is used to track daily sales activities, analyze pipeline movement, and optimize outreach strategies for better results.

Related: Sales Intelligence 101 – Definition, Tools and Best Practices
2. Executive Sales Dashboard
The executive sales dashboard provides a holistic perspective of crucial metrics and aids in making strategic decisions to drive growth and profitability.
Audience: Business Executives and Leaders
Key Metrics:
- Sales Growth Rate
- Total Revenue
- Customer Lifetime Value (CLV)
- Customer Acquisition Cost (CAC)
- Gross Profit Margin
Purpose:
This dashboard provides an overview of sales performance, helping leaders make strategic decisions. It assists in planning sales, launching products, and achieving profitable growth by setting clear objectives, analyzing past performance, and identifying opportunities for growth.

Related: 12 Best Conversational Intelligence Software 2024
3. Sales Marketing Performance Dashboard
This sales performance dashboard bridges communication between marketing and sales teams, aligning efforts and goals for shared success.
Audience: Marketing and Sales Teams
Key Metrics:
- Marketing Qualified Leads (MQLs)
- Conversion Rate by Channel
- Marketing ROI
- Sales Qualified Leads (SQLs)
- Customer Engagement Metrics
Purpose:
It synchronizes marketing strategies with sales objectives, monitoring lead quality and campaign effectiveness for better alignment and collaboration.

Related: How Does Emotional Intelligence Help in Closing More Deals?
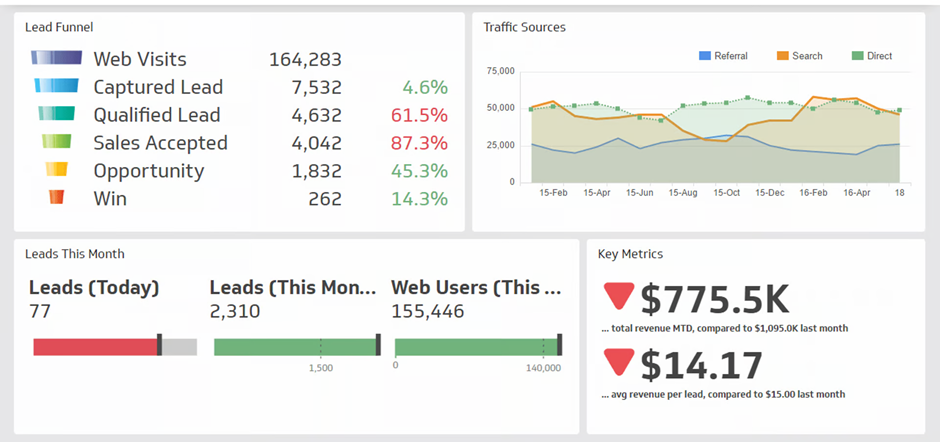
4. Sales Funnel Dashboard
The sales funnel dashboard visualizes and tracks the entire sales process, from lead acquisition to conversion. It offers insights into prospects at each stage, aiding in assessing conversion rates and optimizing strategies.
Audience: Sales Teams and Managers
Key Metrics:
- Leads at Each Stage of the Sales Funnel
- Time Spent at Each Stage
- Drop-off Points in the Funnel
- Conversion Rates at Each Stage
Purpose:
This sales metrics dashboard helps visualize the sales process, identify bottlenecks, and optimize the sales funnel for improved conversions.

Related: What is Ideal Customer Profile in Sales – Framework to ICP
5. Leads Dashboard
The leads dashboard is essential for sales teams, providing valuable insights into lead management and improving conversion rates. It helps prioritize high-value leads by analyzing sources, behaviors, and engagement metrics.
Moreover, tracking lead progression and time spent at each stage helps identify sales challenges like prolonged turnaround times or conversion bottlenecks.
Audience: Sales and Marketing Teams
Key Metrics:
- Lead Volume
- Lead Quality (Lead Scoring)
- Lead Response Time
- Lead Conversion Rates
- Source of Leads
Purpose:
It’s used to monitor lead generation, evaluate lead quality, and enhance lead conversion rates for improved sales performance.
Related: The BANT Method for Lead Qualification
6. Sales Leaderboard
The sales leaderboard is a visual representation of top-performing salespeople, showcasing their achievements and contributions to the team’s success.
Audience: Sales Teams and Managers
Key Metrics:
- Number of Completed Activities (Calls, Emails, Meetings)
- Generated Monthly Recurring Revenue (MRR)
- Customer Retention Numbers
- New Accounts
Purpose:
This sales performance dashboard allows you to see who’s excelling in sales efforts, motivating healthy competition and driving performance across the team.

Related: Elevating Sales Performance: A Comprehensive Guide to Sales Leaderboards
7. Time-Tracking Sales Dashboard
This dashboard is designed for sales teams constantly on the move. It tracks where sales reps spend their time and the revenue they generate.
Audience: Sales Managers and Team Leaders
Key Metrics:
- Time Spent on Different Activities (Meetings, Calls, Emails)
- Activity-to-Revenue Conversion Rates
- Overall Revenue Generated by Sales Reps
- Revenue Generated per Activity
Purpose:
It helps sales managers and team leads monitor sales reps’ productivity and efficiency, optimizing time allocation and maximizing revenue generation.

Related: AI in Sales Enablement Explained: Practical Use Cases & Top Tools
8. Product Performance Dashboard
The product performance dashboard informs product development strategies by showcasing user feedback, feature adoption rates, and usage metrics, steering enhancements to meet user needs effectively.
Audience: Product Managers
Key Metrics:
- Feature Adoption Rate
- Product Usage Metrics
- Time-to-Resolution for Product Issues
- User Feedback
Purpose:
It evaluates product performance, gathers user insights, and guides product development strategies. Additionally, it aids sales teams in predicting user behavior, identifying potential churn signals, and uncovering opportunities for cross-selling or upselling.

Related: 15 Best Sales Automation Tools to Boost Your Revenue in 2024
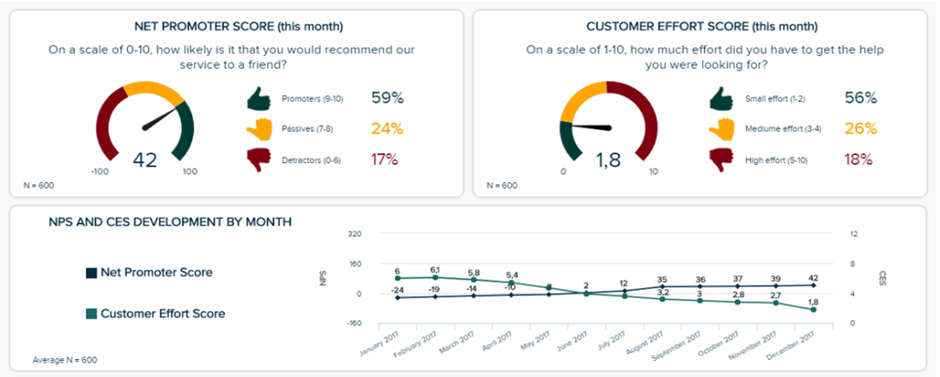
9. Customer Success Dashboard
The customer success dashboard emphasizes customer satisfaction and retention, guiding managers in enhancing customer experiences and minimizing churn rates.
Audience: Support Teams and Customer Success Managers
Key Metrics:
- Customer Satisfaction (CSAT) Score
- Churn Rate
- Support Ticket Resolution Time
- Net Promoter Score (NPS)
- Customer Retention Rate
Purpose:
It monitors customer satisfaction scores, retention rates, product usage analytics, and support ticket resolution times to ensure proactive customer management and foster long-term relationships.
Related: 40+ ChatGPT Prompts To Supercharge Your Sales
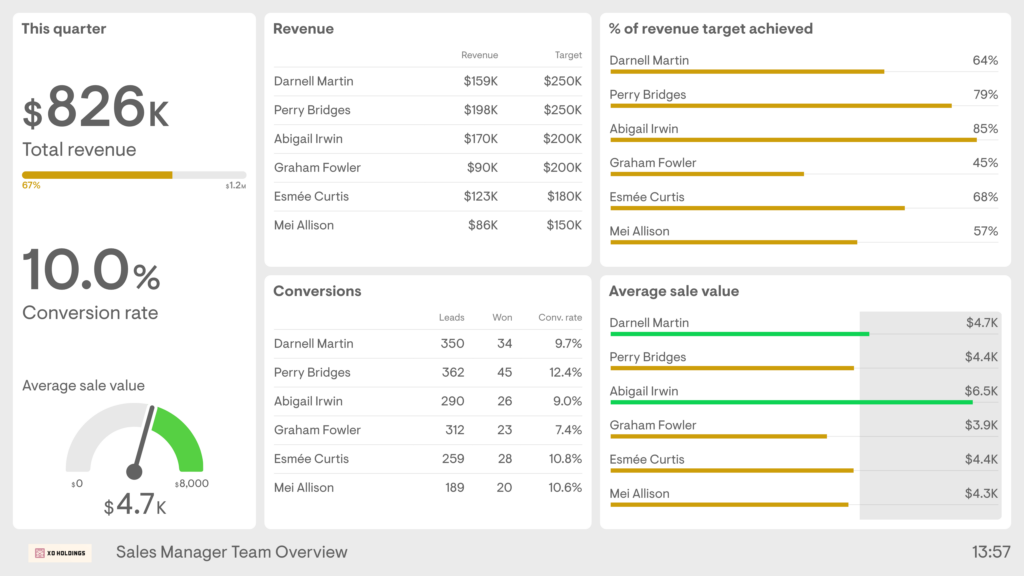
10. Sales Manager Dashboard
The sales manager dashboard offers in-depth insights into team performance, enabling managers to recognize top performers and provide targeted coaching to those who need it. It assists in sales territory management by highlighting regional sales trends for resource allocation and optimizing territories.
Audience: Sales Managers and Leaders
Key Metrics:
- Lead Conversion Rate
- Monthly/Quarterly Sales Performance
- Sales Pipeline Health
- Sales Team Activity
- Average Deal Size
Purpose:
It monitors team performance, optimizes sales strategies, and guides team efforts towards achieving targets by providing actionable insights and facilitating informed decision-making.
Related: How to Use Generative AI for Sales Success
11. Rep Performance Dashboard
The rep performance dashboard caters to sales representatives and managers, focusing on individual performance metrics. It provides a holistic view of each rep’s performance. This dashboard aids in personal growth, allowing reps to monitor progress and pinpoint areas for improvement.
Audience: Sales Managers and Representatives
Key Metrics:
- Individual Sales Targets vs. Actuals
- Average Deal Size per Rep
- Win Rate
- Sales Cycle Length
- Activity Metrics (Calls, Meetings)
Purpose:
This sales dashboard evaluates individual sales performance, sets targets, and enhances team outcomes by providing actionable insights for improvement.

Related: AI in Sales 101: Unveiling Tools and Best Practices to Transform Your Sales Strategy
12. Regional Sales Dashboard
The territory sales dashboard helps managers understand sales in different areas. It shows trends, what customers like, and how much money each region makes. This helps managers decide where to focus resources and what products to stock. It also points out which areas are doing well and where more effort is needed, so businesses can adjust their plans for better sales results.
Audience: Regional Sales Managers
Key Metrics:
- Regional Sales Performance
- Regional Sales Growth
- Pipeline by Territory
- Conversion Rates by Geography
- Average Deal Size per Region
Purpose:
It tracks sales performance across regions, optimizes sales strategies per territory, and identifies regional trends to drive informed decision-making and enhance sales outcomes.

Related: 10 Best Sales Intelligence Software For 2024
How to Create a Sales Dashboard?
Creating a sales dashboard involves several key steps, each of which plays a crucial role in the process. Let’s discuss each step in detail:
Step 1: Decide Which Sales Metrics to Track
Start by determining what specific sales metrics and Key Performance Indicators (KPIs) are important for your business.
Ask yourself:
- What metrics are regularly reviewed in meetings and among the sales team?
- What are the key performance indicators (KPIs)?
- Are some metrics more important than others?
Here are some popular sales metrics that you need to include:
1. Total Revenue
Formula: Total Revenue = Sum of all sales revenue
Total revenue represents the overall income generated from sales within a specific time period. It provides a fundamental measure of a company’s financial performance.
2. Conversion Rate
Formula: Conversion Rate = (Number of conversions / Number of leads) * 100
The conversion rate measures the percentage of leads that result in a desired action, such as a sale. It indicates the effectiveness of your sales and marketing efforts in turning leads into customers.
3. Sales Growth Rate
Formula: Sales Growth Rate = ((Current Period Sales – Previous Period Sales) / Previous Period Sales) * 100
The sales growth rate shows the percentage increase or decrease in sales revenue over a specific period compared to the previous period. It reflects the trajectory of your sales performance.
4. Sales Win Rate
Formula: Sales Win Rate = (Number of Won Deals / Number of Opportunities) * 100
The sales win rate measures the percentage of opportunities that result in closed deals. It indicates the effectiveness of your sales team in winning business and closing deals.
Identifying these metrics will help you focus on the most relevant data for monitoring and decision-making.
Related: How To Improve Sales Performance With 11 Key Metrics
Step 2: Identify Data Sources
Once you’ve determined which metrics to track, you need to identify where the relevant data resides. Some of the most common data sources include:
- CRM Systems: Salesforce, HubSpot, Zoho CRM, Microsoft Dynamics – store leads, opportunities, contacts, accounts, and sales activities.
- Spreadsheets: Excel, Google Sheets – contain sales transactions, customer details, and performance metrics.
- Marketing Platforms: HubSpot, Marketo, Mailchimp – data on campaigns, lead generation, and customer interactions.
- Sales and Financial Reports: Internal reports provide insights into revenue, profitability, and financial performance.
- Website Analytics: Google Analytics, Adobe Analytics – track visitor behavior, conversions, and online sales.
- Sales Meetings and Call Records: Goodmeetings captures meeting notes, action items, deal updates, and call records.
- Call and Email Logs: Zoom, Microsoft Teams, Gmail – logs offer insights into sales interactions and customer engagement.
Knowing where to find the data ensures that you can access it when building your dashboard.
Related: 10 Best Meeting Recording Software to Consider in 2024
Step 3: Determine Dashboard Viewing Options
Consider how you and your team will access the dashboard. Here are the different options for accessing the dashboard:
- TV Dashboard: Displayed on a TV screen in the office for easy visibility by the team.
- Mobile App: Accessible through a mobile application, allowing team members to view the dashboard on their smartphones or tablets.
- Desktop Computer: Viewable on a desktop computer or laptop, providing a comprehensive display for detailed analysis and decision-making.
Understanding the preferred viewing method will influence the design and layout of your dashboard.
Step 4: Evaluate Dashboard Software
Research and evaluate different dashboard software options based on your specific requirements. Here are factors to consider when choosing the best dashboard software provider:
- Data Integration: Ensure seamless connectivity with CRM systems, spreadsheets, and marketing platforms.
- Customization: Look for options to customize the dashboard to fit your branding and specific needs.
- Ease of Use: Opt for a user-friendly platform that doesn’t require extensive technical skills to set up and navigate.
- Scalability: Choose software that can grow with your business, handling increased data and user volume.
- Performance: Prioritize high performance and reliability to ensure minimal downtime and fast data processing.
- Data Security: Ensure robust security features to protect sensitive information and comply with regulations.
- Cost: Evaluate pricing structures, including subscription fees and additional charges for features and support.
- Customer Support: Seek providers offering reliable technical assistance, training, and troubleshooting.
- Integration: Check compatibility with other tools and software you use, like project management systems or analytics platforms.
Choose a software vendor that best meets your needs and budget. With Goodmeetings, you will get access to customizable dashboards to visualize important sales data.
Source: Goodmeetings
Related: What is Sales Acceleration? – Tools and Tactics Included
Step 5: Pull Data into the Dashboard
Once you’ve selected your dashboard software, it’s time to pull data from your identified data sources into the dashboard. This typically involves connecting your data services to the dashboard platform and configuring the data integration settings. Make sure that the data is pulled accurately and regularly to keep your dashboard up-to-date.
Step 6: Choose Visual Representations
Select appropriate visual representations for presenting your sales data. Here are different visualization options to consider when presenting sales data:
- Line Graphs: Track trends over time.
- Bar Charts: Compare different sales metrics.
- Pie Charts: Show proportions or percentages.
- Area Charts: Illustrate cumulative totals over time.
- Scatter Plots: Visualize relationships between variables.
- Heatmaps: Highlight patterns in large datasets.
- Histograms: Display the distribution of a single variable.
- Gantt Charts: Visualize project timelines.
- Funnel Charts: Illustrate sales or marketing funnel stages.
- Treemaps: Visualize hierarchical data structures.
- Bullet Graphs: Compare actual versus target performance.
Consider the nature of the data and the audience’s preferences when choosing visualizations. For example, use line graphs to track trends over time, bar charts to compare different sales metrics, and pie charts to show proportions.
Related: A Complete Guide to Sales Call Reporting: Tips, Templates & Tools
Step 7: Design and Customize the Dashboard
Design the layout of your dashboard, arranging the visual representations in a logical and intuitive manner. Customize the dashboard to reflect your brand’s colors and style, making it visually appealing and easy to navigate. Many people also make Excel sales dashboards but the process is very time-consuming.
Step 8: Share the Dashboard
Once your dashboard is ready, share it with your team and sales executives to encourage adoption and collaboration. Provide instructions on how to access the dashboard and interpret the data effectively. Get feedback from users to continuously improve the dashboard based on their needs and preferences.
Related: How to Use AI For Sales Training – Tools and Best Practices
What Makes a Great Sales Dashboard?
Here are the key factors that make a great sales dashboard for businesses:
1. Relevance
It focuses on the most important sales metrics and Key Performance Indicators (KPIs) that align with business goals and objectives.
2. Clarity
It presents data in a clear and easy-to-understand manner, using visualizations that make trends and insights immediately apparent.
3. Customization
It allows users to customize the dashboard according to their specific needs and preferences, including the ability to choose metrics, adjust layouts, and set filters.
4. Interactivity
It offers interactive features that enable users to drill down into data, explore different views, and adjust parameters to gain deeper insights.
5. Real-Time Updates:
It provides real-time or near-real-time updates on sales performance, ensuring that users always have access to the latest information.
6. Accessibility
It can be accessed easily from various devices and platforms, including desktop computers, mobile devices, and tablets, allowing users to view the dashboard whenever and wherever they need it.
7. Integration
It integrates seamlessly with other tools and systems used within the organization, such as CRM systems, marketing platforms, and financial software, to provide a comprehensive view of sales performance.
8. Actionability
It not only presents data but also offers actionable insights and recommendations that help users make informed decisions and take appropriate actions to improve sales performance.
9. Scalability
It can scale with the business as it grows, accommodating an increasing volume of data, users, and complexity without sacrificing performance or usability.
10. User-Friendly Design
It has a user-friendly design that is intuitive to navigate, with clear labels, easy-to-use filters, and logical layouts that guide users to the information they need.
Related: ChatGPT for Sales: 10 Ways to Boost Your Sales Revenue Using ChatGPT
Sales Dashboard Templates
Here are three free sales dashboard templates to streamline your sales tracking and decision-making processes:
Template 1

Template 2

Template 3
Source: Canva
Related: Mastering Sales Demos: The Ultimate Guide to Winning & Closing More Deals
Monitor Sales Team Performance Using GoodMeetings

Source: Goodmeetings
To boost sales productivity, it’s important to monitor your sales team’s performance closely. With a large team, keeping track of everyone can be challenging. That’s where GoodMeetings steps in.
GoodMeetings simplifies the process by recording, transcribing, summarizing, and analyzing online sales calls and meetings. This tool offers two key benefits:
- Automates meeting note-taking, saving time on mundane tasks.
- Facilitates review of meeting and call recordings to assess sales team performance.
Additionally, GoodMeetings offers customizable analytics dashboards designed to enhance sales productivity. These dashboards are tailored to provide insights into critical areas:
- Client Performance Dashboard
- Competitor Performance Dashboard
- Sales Rep Performance Dashboard
The Sales Rep Performance Dashboard enables effortless tracking of individual sales representatives’ performance. By monitoring key metrics, you can identify strengths and areas for improvement, allowing for targeted training and coaching to boost overall productivity across your sales team.

Source: Goodmeetings
Related: Getting Started with the Goodmeetings Notetaker
But that’s not all, Goodmeetings can help with many other things like:
- Automated Meeting Insights: GoodMeetings captures meeting intel including call recordings, transcriptions, and analytics, saving time on manual tasks.
- Customized Dashboards: Improve sales performance with client, competitor, and sales rep performance dashboards, facilitating targeted improvements.
- Meeting KPI Tracking: GoodMeetings monitors meeting metrics like talk-to-listen ratio, word speed, topic mentions, and longest monologue. This helps teams understand communication dynamics and improve sales interactions.
- Real-time Assistance: Receive instant support during meetings through natural language querying and AI alerts, enhancing sales conversations and conversions.
- Elimination of Mundane Tasks: Streamline workflows with human-level summaries, action item integration, and timely notifications, ensuring focus on core sales activities.
- Coaching Tools: Utilize AI-generated battlecards, summaries, and actionable insights to coach sales reps effectively, leading to continuous improvement.
- Integration with CRM: Deep CRM integration allows seamless workflow management, ensuring smooth communication and task execution.
- Sales Battlecards: Use AI-based nudges and battlecards, offering contextual tooltips for real-time guidance during customer interactions.
- Live Support on Calls: Sales reps receive real-time coaching during challenging conversations via private chat.

Source: Goodmeetings
With GoodMeetings, you can make sure your sales team is working efficiently and hitting their targets. It’s an easy way to manage your team and make sure everyone is doing their best.
Now, you can easily start using Goodmeetings for free with a 7-day free trial offer and even request a free demo to see how it works! Enjoy 10x sales rep performance with Goodmeetings!
GET IN TOUCH